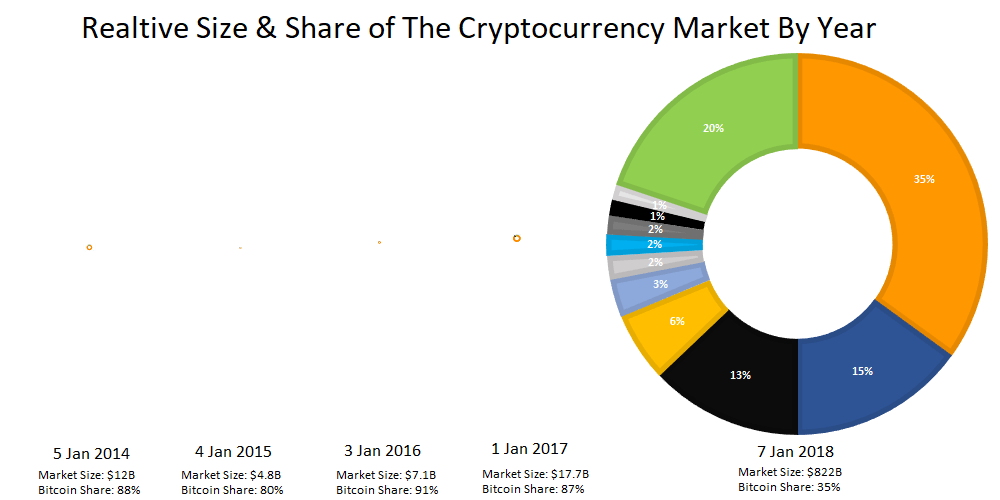
This post is either really well or very poorly timed. When we first had the idea for it, the total cryptocurrency market had soared to an estimated $822 billion. But as of the time of publication it has plunged by 47%, down to $433 billion (17 Jan 2018).
Nevertheless, given the recent explosion in both the value and interest in Bitcoin and other cryptocurrenices, we thought it would be interesting to take a look back at how the top 10 cryptocurrenices have changed between the start of 2014 and the start of 2018.
This is quite a long post, so here are a few highlights if you don’t want to read the whole thing.
- Despite Bitcoin’s meteoric rise in price, it has never been the best performing cryptocurrency on an annualised basis.
- Bitcoin’s share of the cryptocurrency market peaked in 2016, where it was 91% of the market and until 2018 it had never been less than 79% of the cryptocurrency market by value.
- 2014-2015 was the worst year to be a cryptocurrency investor. A $100 investment in each of the top 10 currencies would have resulted in a $831 loss over the year. However, if you had stuck it out until 7 Jan 2018, your initial $1,000 investment would have been worth $15,802.
- 2016 was the best year to get into the market. A $100 investment in each of the top 10 coins at the time would have been worth $312,326 by 7 Jan 2018.
- The second best year to get in the market was the start of 2017. A $100 investment in each of the top 10 coins at the time would have been worth $95,659, just 1 year later.
- Ripple was the best performing currency in both 2014 and 2017.
- In 2015, Litecoin had the best 1 year return, although Stellar Lumens had the best return from 2015-2018.
- Ethereum was the best performing currency of 2016.
- Only Bitcoin, Ripple and Litecoin appear in the Top 10 list for all years.
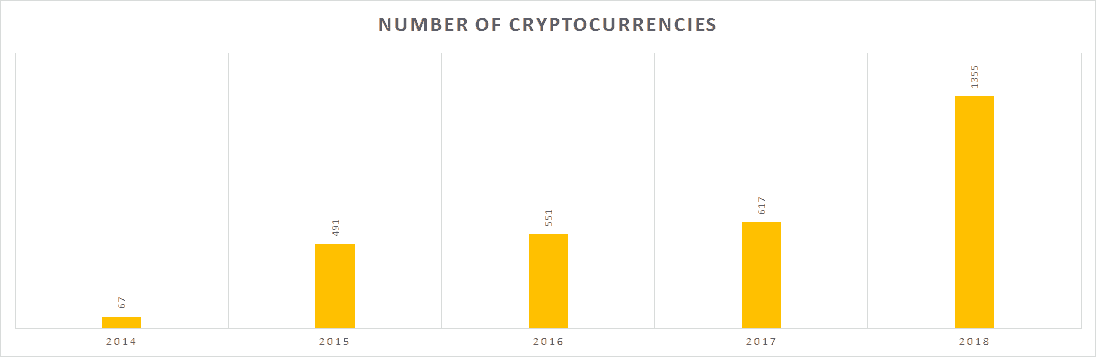
- While the greatest total number of new coins were added between 2017 and 2018 (738; 119% YoY increase) the big explosion happened between 2014 and 2015, when the total number coins increased by 633%.
Disclaimer: This post is in no way advocating that you invest in Cryptocurrencies. The recent plunge in prices, shows just how risky it can be. Moreover, while we have previously owned Ripple, Ethereum and Litecoin we currently hodl no cryptocurrencies.
About The Cryptocurrency Market Data
All our data on prices and market cap come from Coinmarketcap.com. Since the market moves so quickly, it’s almost impossible to get data that stays good for more than a few minutes.
Fortunately, Coinmarketcap.com provides weekly historical snapshots going back to 2013. We’ve used the following snapshots to generate our data.
Each of these represents the first snapshot of the year. Therefore, our comparisons are as close to year on year comparisons as possible. However, they will by their nature, fail to capture any fluctuations within a given year.
Finally, while we realise that using Coinmarketcap.com as our data source may prove controversial (especially among Ripple investors), so you take or leave our findings based on that fact. We’ve used them for the simple reason that they offer some of the best historic data out there.
Growth In the Cryptocurrency Market 2014-2018

The Top 10 Cryptocurrencies In 2014

Bitcoin really was the cryptocurrency market back in 2014. At the time it was worth over $10.5 billion USD out of a total market size of around $12 billion USD.
Interestingly, it’s market cap in 2014 would still be enough to make it the 11st largest cryptocurrency on 7 January 2018 (and 6th by 17 January 2018).
Litecoin and Ripple were numbers 2 and 3 back in 2014 and still in the Top 10 in 2018. However, most of the coins have dropped off the map with BitShares PTS disappearing entirely.
Below you can see a table of the ranking in 2014 (based on market cap), ranking on 7 January 2018, the total market cap, market share, price and finally it’s equivalent 2018 rank (where the coin would rank in 2018 based on its 2014 market cap).
| Rank | Name | Rank In 2018 | Market Cap | Market Share | Price | Equivalent 2018 Rank |
|---|---|---|---|---|---|---|
| 1 | Bitcoin | 1 | $10,543,005,152 | 88.2% | $864.89000 | 11 |
| 2 | Litecoin | 6 | $617,417,996 | 5.2% | $25.13000 | 65 |
| 3 | Ripple | 2 | $218,748,697 | 1.8% | $0.02798 | 128 |
| 4 | Peercoin | 161 | $151,559,613 | 1.3% | $7.21000 | 163 |
| 5 | Omni | 262 | $110,190,773 | 0.9% | $177.88000 | 197 |
| 6 | Nxt | 71 | $60,503,322 | 0.5% | $0.06050 | 268 |
| 7 | Namecoin | 238 | $59,406,572 | 0.5% | $7.74000 | 271 |
| 8 | BitShares PTS | - | $24,970,170 | 0.2% | $19.64000 | 382 |
| 9 | Quark | 473 | $22,539,866 | 0.2% | $0.09124 | 391 |
| 10 | Megacoin | 560 | $18,130,469 | 0.2% | $0.83984 | 420 |
2014 Return On Investment
As mentioned above all figures for 2018 are for 7 Jan 2018, and do not reflect the current price or value of any currency.
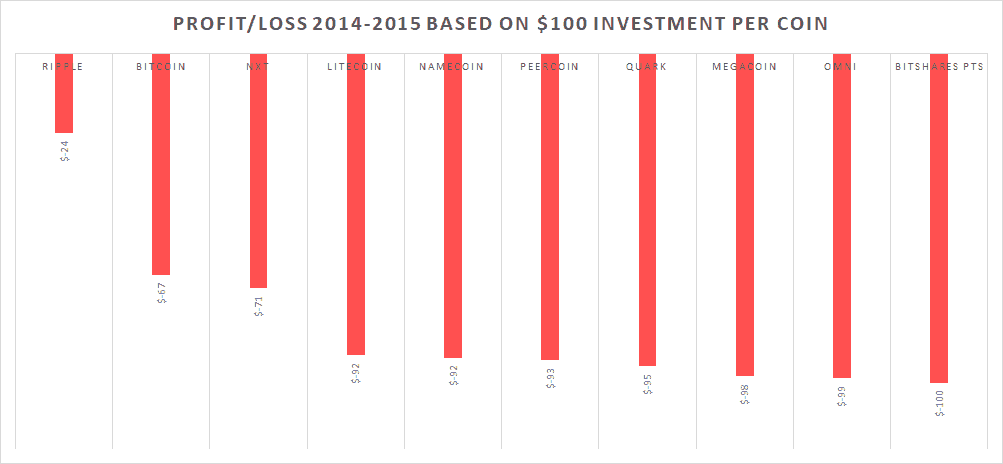
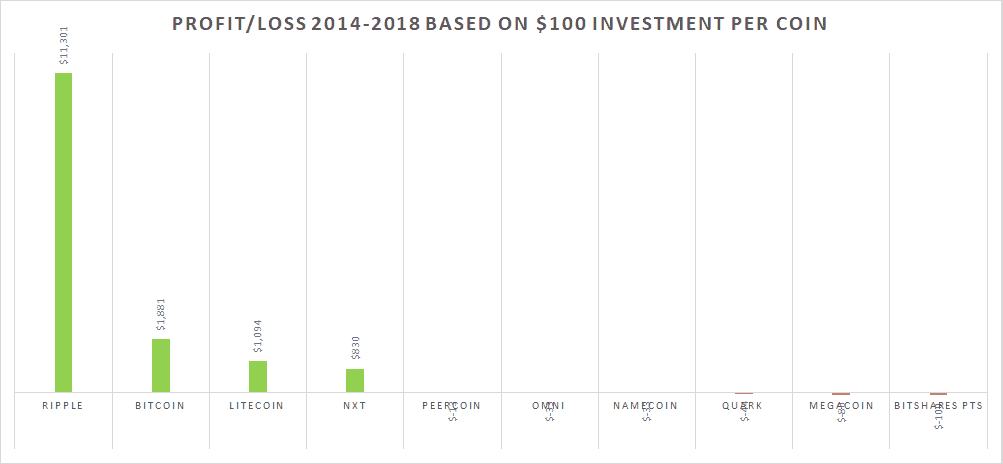
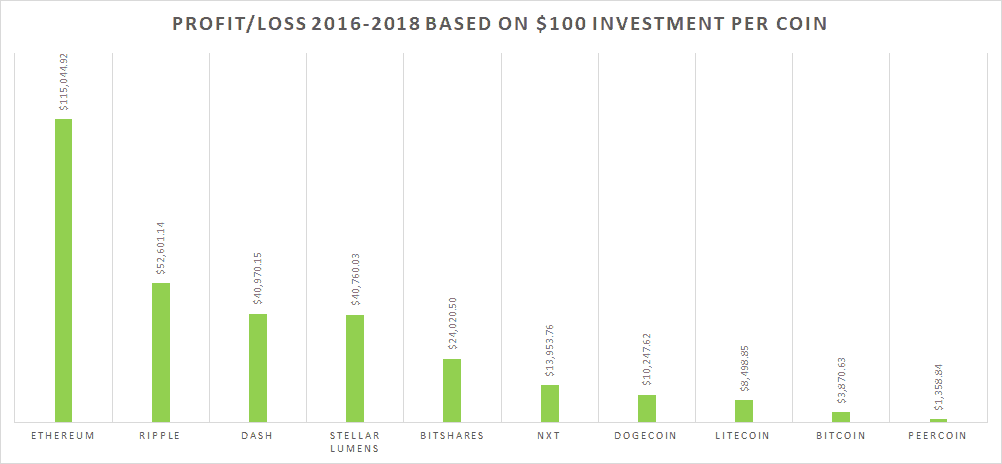
The two charts above show the 1 year profit/loss and profit/loss in 2018, if you had invested just $100 in each of the top 10 currencies in 2014.
At the start of 2015, things would have looked pretty bleak. Your initial $1,000 investment would only have been worth $169, a $831 loss. Every single currency saw declines over the year, with Ripple performing the least poorly.
However, if you’d held on until 2018, you would have $15,802.17, for a profit of $14,802.17. But you would have still lost money on 6 out 10 coins.
Ripple would have accounted for 76% of your gains, with Bitcoin only accounting for 13%.
You can see the table below for profit and loss figures per currency.
| Name | 1 Year | In 2018 |
|---|---|---|
| Ripple | $-24 | $11,301 |
| Bitcoin | $-67 | $1,881 |
| Litecoin | $-92 | $1,094 |
| Nxt | $-71 | $830 |
| Peercoin | $-93 | $-13 |
| Omni | $-99 | $-33 |
| Namecoin | $-92 | $-33 |
| Quark | $-95 | $-44 |
| Megacoin | $-98 | $-80 |
| BitShares PTS | $-100 | $-100 |
The Top 10 Cryptocurrencies In 2015
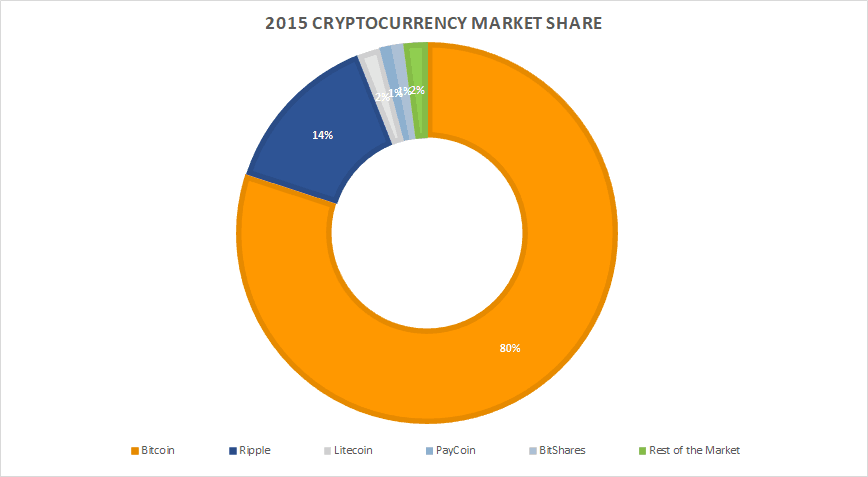
2014-2015 was not a great year for the cryptocurrency market. The total market value at the start of 2015 was only $4.8 billion USD, a decrease of nearly 60% YoY.
Moreover, Bitcoin dropped just below 80% of the market, with Ripple taking second spot at 13.6%. Litecoin remained in the top 10 with Stellar Lumens making their debut.
Interestingly, despite the market contraction and price decrease, Ripple increased it’s market cap by just over 200% YoY due to an increasing amount of the currency in circulation.
| Rank | Name | Rank 2018 | Marketcap | Market Share | Price | Equivalent 2018 Rank |
|---|---|---|---|---|---|---|
| 1 | Bitcoin | 1 | $3,856,201,593 | 79.6% | $281.79000 | 19 |
| 2 | Ripple | 2 | $656,661,649 | 13.6% | $0.02120 | 61 |
| 3 | Litecoin | 6 | $74,761,847 | 1.5% | $2.12000 | 243 |
| 4 | PayCoin | 809 | $39,464,544 | 0.8% | $3.20000 | 317 |
| 5 | BitShares | 26 | $36,149,374 | 0.7% | $0.01447 | 333 |
| 6 | MaidSafeCoin | 79 | $21,223,340 | 0.4% | $0.04690 | 398 |
| 7 | Nxt | 71 | $17,361,750 | 0.4% | $0.01736 | 427 |
| 8 | Dogecoin | 30 | $16,084,147 | 0.3% | $0.00017 | 441 |
| 9 | Stellar Lumens | 8 | $16,060,639 | 0.3% | $0.00451 | 443 |
| 10 | Peercoin | 161 | $11,080,850 | 0.2% | $0.50400 | 496 |
2015 Return On Investment
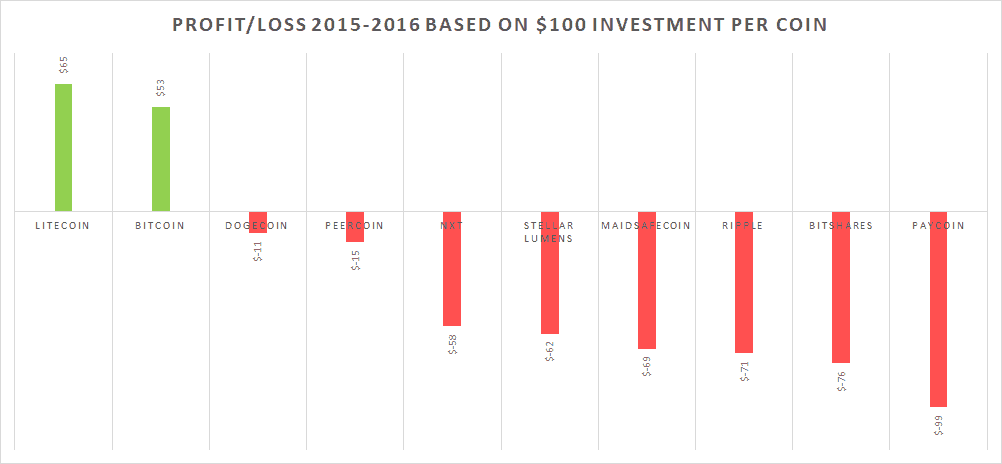
While getting into the market in 2015 was better than 2014, things still didn’t exactly look great one year later. If you had invested $100 into each of the top 10 coins, you would lost $343 by the same time in 2016. 8 out 10 coins decreased in price, with only Litecoin and Bitcoin positive for the year.
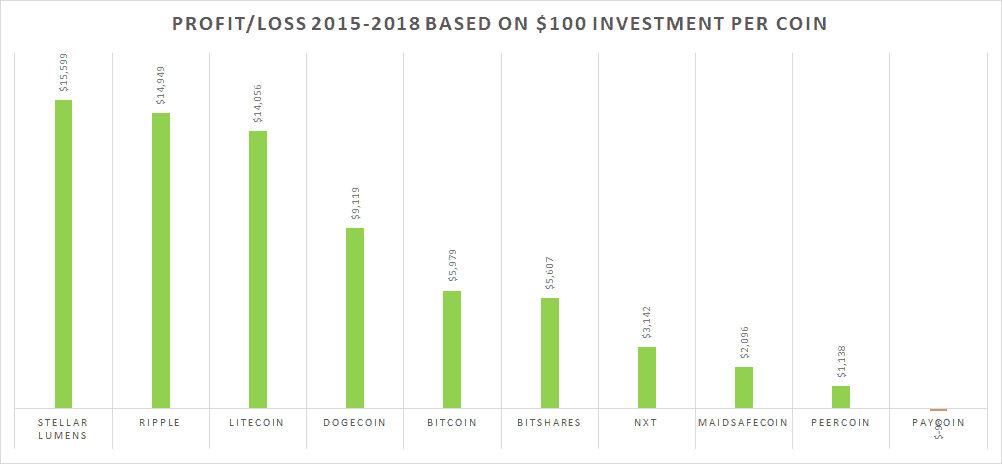
However, if you’d stayed invested in all top 10 coins, the total value of your $1,000 investment would have grown to $72,587.55 lead by Stellar Lumens, Ripple and Litecoin.
However, you would have made a profit on every currency except PayCoin, including joke cryptocurrency Dogecoin, which would have yielded a profit of $9,119.
You can see the specific 1-year and 3-year (2018) profit and loss figures in the table below.
| Name | 1 Year | In 2018 |
|---|---|---|
| Stellar Lumens | $-62 | $15,599 |
| Ripple | $-71 | $14,949 |
| Litecoin | $65 | $14,056 |
| Dogecoin | $-11 | $9,119 |
| Bitcoin | $53 | $5,979 |
| BitShares | $-76 | $5,607 |
| Nxt | $-58 | $3,142 |
| MaidSafeCoin | $-69 | $2,096 |
| Peercoin | $-15 | $1,138 |
| PayCoin | $-99 | $-98 |
The Top 10 Cryptocurrencies In 2016
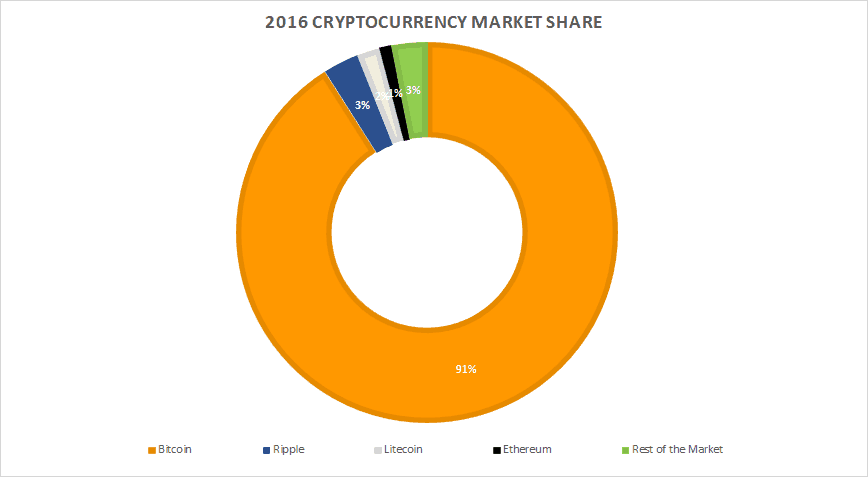
This was by far the best year to become a cryptocurrency investor. The market recovered from the 2015 low and was worth $7.1 billion, a 46% YoY increase. Although still remained well below what it had been worth at the start of 2014.
This was also the year, Bitcoin would achieve it’s greatest share of the market at just over 91%.
Ethereum made its first appearance in the top 10 at position 4. And while Ripple remained number 2, it had a terrible year, dropping nearly 70% in market value.
Overall, this is when the top names start to look a bit more familiar with 5 of the top 10, being there in 2018.
| Rank | Name | Rank 2018 | Marketcap | Market Share | Price | Equivalent 2018 Rank |
|---|---|---|---|---|---|---|
| 1 | Bitcoin | 1 | $6,487,950,808 | 91.5% | $431.45000 | 16 |
| 2 | Ripple | 2 | $202,989,110 | 2.9% | $0.00605 | 135 |
| 3 | Litecoin | 6 | $153,184,845 | 2.2% | $3.49000 | 161 |
| 4 | Ethereum | 3 | $72,409,494 | 1.0% | $0.95328 | 246 |
| 5 | Dash | 11 | $19,820,453 | 0.3% | $3.25000 | 406 |
| 6 | Dogecoin | 30 | $15,091,783 | 0.2% | $0.00015 | 452 |
| 7 | Peercoin | 161 | $9,788,940 | 0.1% | $0.42774 | 510 |
| 8 | BitShares | 26 | $8,687,533 | 0.1% | $0.00342 | 523 |
| 9 | Stellar Lumens | 8 | $8,386,835 | 0.1% | $0.00173 | 528 |
| 10 | Nxt | 71 | $7,329,199 | 0.1% | $0.00733 | 540 |
2016 Return On Investment
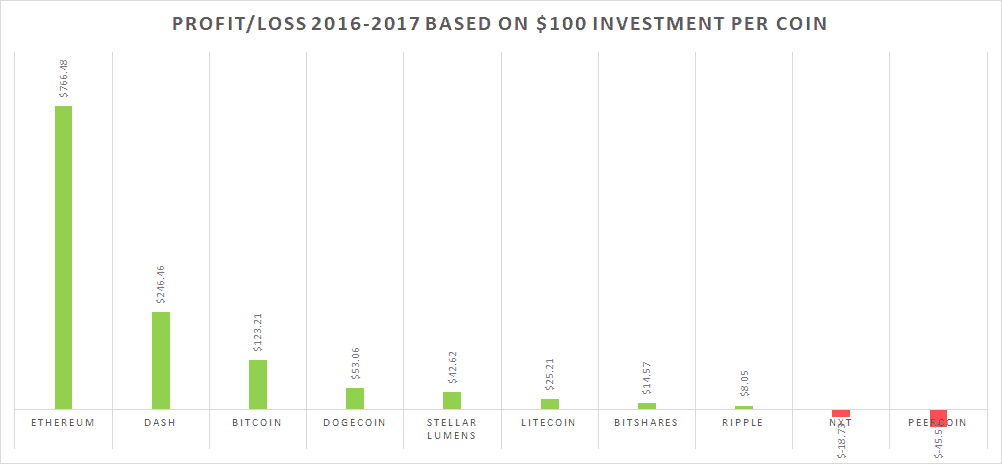
As mentioned above, 2016 was a great year to get into the market. Buying $100 worth of each of the top 10 coins would have resulted in a profit of $1,215 just one year later, with Ethereum accounting for 63% of the gain. Unlike previous years, only 2 (Nxt & Peercoin) of the top 10 saw price declines over the year.
However, if you’d managed to hold on until 2018, your $1,000 investment would have been worth a staggering $312,326.44. Ethereum was once again the big winner ($115,045 profit), followed by Ripple ($52,601 profit), Dash ($40,970 profit) and Stellar Lumens ($40,760 profit).
Peercoin was the worst performing of the top 10 and even it would have resulted in a $1,359 profit.
You can see the 1 and 2-year (2018) profit and loss figures below:
| Name | 1 Year | In 2018 |
|---|---|---|
| Ethereum | $766 | $115,045 |
| Ripple | $8 | $52,601 |
| Dash | $246 | $40,970 |
| Stellar Lumens | $43 | $40,760 |
| BitShares | $15 | $24,021 |
| Nxt | $-19 | $13,954 |
| Dogecoin | $53 | $10,248 |
| Litecoin | $25 | $8,499 |
| Bitcoin | $123 | $3,871 |
| Peercoin | $-46 | $1,359 |
The Top 10 Cryptocurrencies In 2017
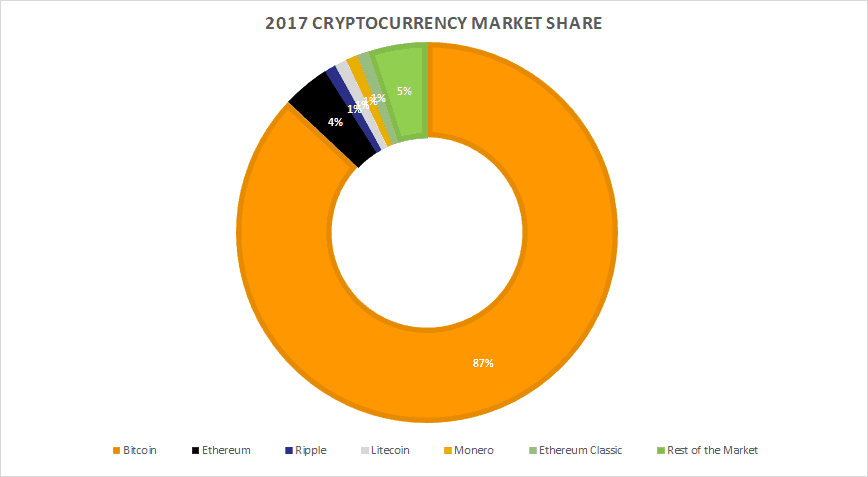
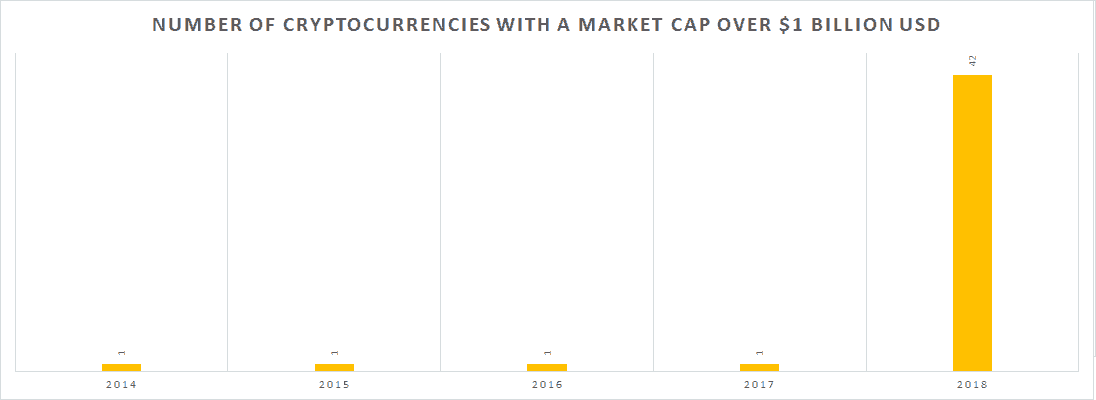
Between 2016 and 2017 the total cryptocurrency market increased by 150% to $17.7 billion USD. Yet, just over 1 year ago, Bitcoin was still the only currency worth more than $1 billion.
Bitcoin and the market also both finally surpassed their values from 2014, but interestingly only 4 of the top 10 coins would still be in the top 10 in 2018, fewer than in 2016.
| Rank | Name | Rank 2018 | Marketcap | Market Share | Price | Equivalent 2018 Rank |
|---|---|---|---|---|---|---|
| 1 | Bitcoin | 1 | $15,482,057,105 | 87.5% | $963.06000 | 8 |
| 2 | Ethereum | 3 | $722,829,967 | 4.1% | $8.26000 | 58 |
| 3 | Ripple | 2 | $237,638,345 | 1.3% | $0.00654 | 123 |
| 4 | Litecoin | 6 | $214,726,272 | 1.2% | $4.37000 | 132 |
| 5 | Monero | 13 | $185,582,499 | 1.0% | $13.58000 | 144 |
| 6 | Ethereum Classic | 18 | $127,129,044 | 0.7% | $1.45000 | 179 |
| 7 | Dash | 11 | $78,695,538 | 0.4% | $11.26000 | 235 |
| 8 | MaidSafeCoin | 79 | $44,886,080 | 0.3% | $0.09918 | 298 |
| 9 | Augur | 47 | $41,714,289 | 0.2% | $3.79000 | 313 |
| 10 | Steem | 34 | $39,078,093 | 0.2% | $0.17022 | 318 |
2017 Return On Investment
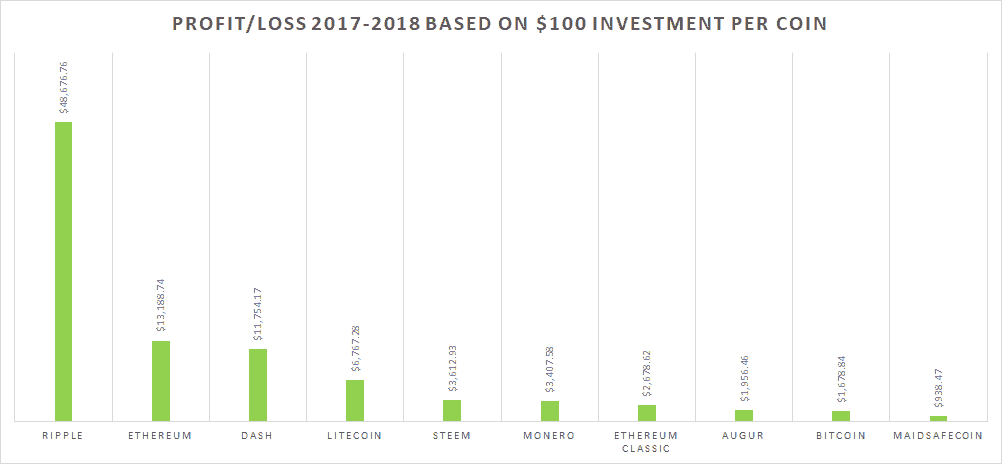
Unsurprisingly, given the growth of the market over 2017, you’d have done really well to invest at the start of 2017. A $100 investment in each of the top 10 coins, would have been worth $95,659.86 by the start of 2018.
Each of the top 10 coins was worth more at the start 2018 than they were a year earlier, with profits varying between $48,676.76 for top gainer Ripple to “only” $938.47 for MaidSafeCoin.
Interestingly, Bitcoin was actually the second worst performer “only” generating a profit of $1,678.84 off a $100 investment.
Also worth noting that this was the second time Ripple was the top performer. Below you can see profit and loss figures by coin:
| Name | In 2018 |
|---|---|
| Ripple | $48,676.76 |
| Ethereum | $13,188.74 |
| Dash | $11,754.17 |
| Litecoin | $6,767.28 |
| Steem | $3,612.93 |
| Monero | $3,407.58 |
| Ethereum Classic | $2,678.62 |
| Augur | $1,956.46 |
| Bitcoin | $1,678.84 |
| MaidSafeCoin | $938.47 |
The Top 10 Cryptocurrencies In 2018
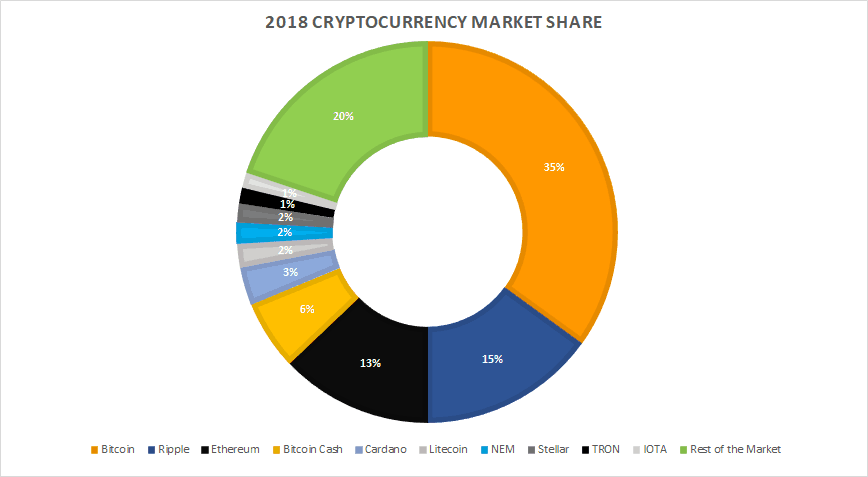
2017 was the year Bitcoin and cryptocurrencies in general entered the mainstream.
This meant that the market at the start of 2018 looked radically different from previous years. First of all, the size of the market increased 4,546% to a staggering $822 billion.
Bitcoin remained the number 1 currency, with price above $17,000 and a market cap of $287 billion. However, its share of the market decreased dramatically from over 87% to just 35% due to the even bigger gains in other currencies.
Each of the top 5 currencies was worth more than the entire market just a year earlier and 42 were worth over $1 billion USD.
Below you will find the Top 10 Cryptocurrencies on 7 January 2018:
| Rank | Name | Marketcap | Market Share | Price |
|---|---|---|---|---|
| 1 | Bitcoin | $287,582,315,011 | 35.0% | $17,131.27000 |
| 2 | Ripple | $123,601,355,156 | 15.0% | $3.19000 |
| 3 | Ethereum | $106,276,577,298 | 12.9% | $1,097.65000 |
| 4 | Bitcoin Cash | $48,683,234,684 | 5.9% | $2,881.03000 |
| 5 | Cardano | $26,227,470,005 | 3.2% | $1.01000 |
| 6 | Litecoin | $16,400,509,416 | 2.0% | $300.10000 |
| 7 | NEM | $15,034,147,365 | 1.8% | $1.67000 |
| 8 | Stellar | $12,666,677,496 | 1.5% | $0.70851 |
| 9 | TRON | $11,199,707,987 | 1.4% | $0.17034 |
| 10 | IOTA | $11,144,525,870 | 1.4% | $4.01000 |
Postscript: 07 January 2018 – 17 January 2018
The last 10 days have seen another radical change in the market. As mentioned at the start, the market has lost nearly half it’s total value in less than 2 weeks. A loss of $389 billion worth of market value.
So how have each of our top 10 currencies from 7 Jan 2018 performed over that period?
- Bitcoin: -43%
- Ripple: -71%
- Ethereum: -26%
- Bitcoin Cash: -50%
- Cardano: -54%
- Litecoin: -50%
- NEM: -59%
- Stellar: -54%
- TRON: -72%
- IOTA: -49%
Note the amounts above are almost certainly out of date by the time you read this. You can check live prices on https://coinmarketcap.com/
TRON and Ripple have been the big losers, dropping more than 70% each, with Ethereum doing the least badly at -26%.
So is this the market crash that has been widely predicted?
It’s certainly starting to look that way. However that said, the market is still worth 24X times what it was at the start of 2017.
Moreover, the fall between 2014 and 2015 was around 60%, so this has happened before, just never at the scale and value we’re seeing here.
We hope you liked this look back at How The Top 10 Cryptocurrencies have changed over the past 5 years. Please help us by sharing this post with your friends and let us know what you think in the comment section below:
Final disclaimer: This post is for information purposes only and should not be used in any way to make any sort of investment decisions. While we’ve tried to be as accurate as possible with all data presented, errors may exist for which we take no responsibility.
Our Top Guides
- 11 Best Card Machines From £19
- 11 Best UK Online Payment Systems
- 21 Best Ecommerce Platforms In The UK
- Top 100 UK Merchant Service Providers
Other Popular Guides
- UK Merchant Account & Credit Card Processing Fee Comparison
- How to Accept Card Payments Online, In-Store, & By Phone
- Payment Gateways In The UK: What You Need To Know
- Square Card Reader Reviews: UK Payment Fees & Pricing Compared
- SumUp Card Reader Reviews: UK Fees & Pricing
- Dojo Go Card Machine Reviews, Pricing & Fees
- Worldpay Reviews: UK Fees & Pricing
- Top 10 UK Direct Debit Bureau & Recurring Payments Companies
- Contactless Mobile Card Payment Readers: Which Is Cheapest?
- PDQ Machines: Cheap Chip & Pin Card Payment Terminals From £19
- 7 Best Mobile Card Readers With Built-In Receipt Printers
- Credit Card & PDQ Machine Rental Cost: Hire From Just £19
- Square vs Zettle Vs Worldpay & Sumup: Card Reader Comparison
muhammedabdulganiyu42@gmail.com abdulganiyh says
Great ideal
Noddy says
Yeah 2018 pretty rough year for investors who didn’t get out.Hopefully going forward we will be wiser,and happier.Good luck to all the crypto investors for 2019 and beyond.
lh says
really lucky arent they even tho we face some bearish pattern but we still hodl
Ashish says
Quite impressive to study in depth