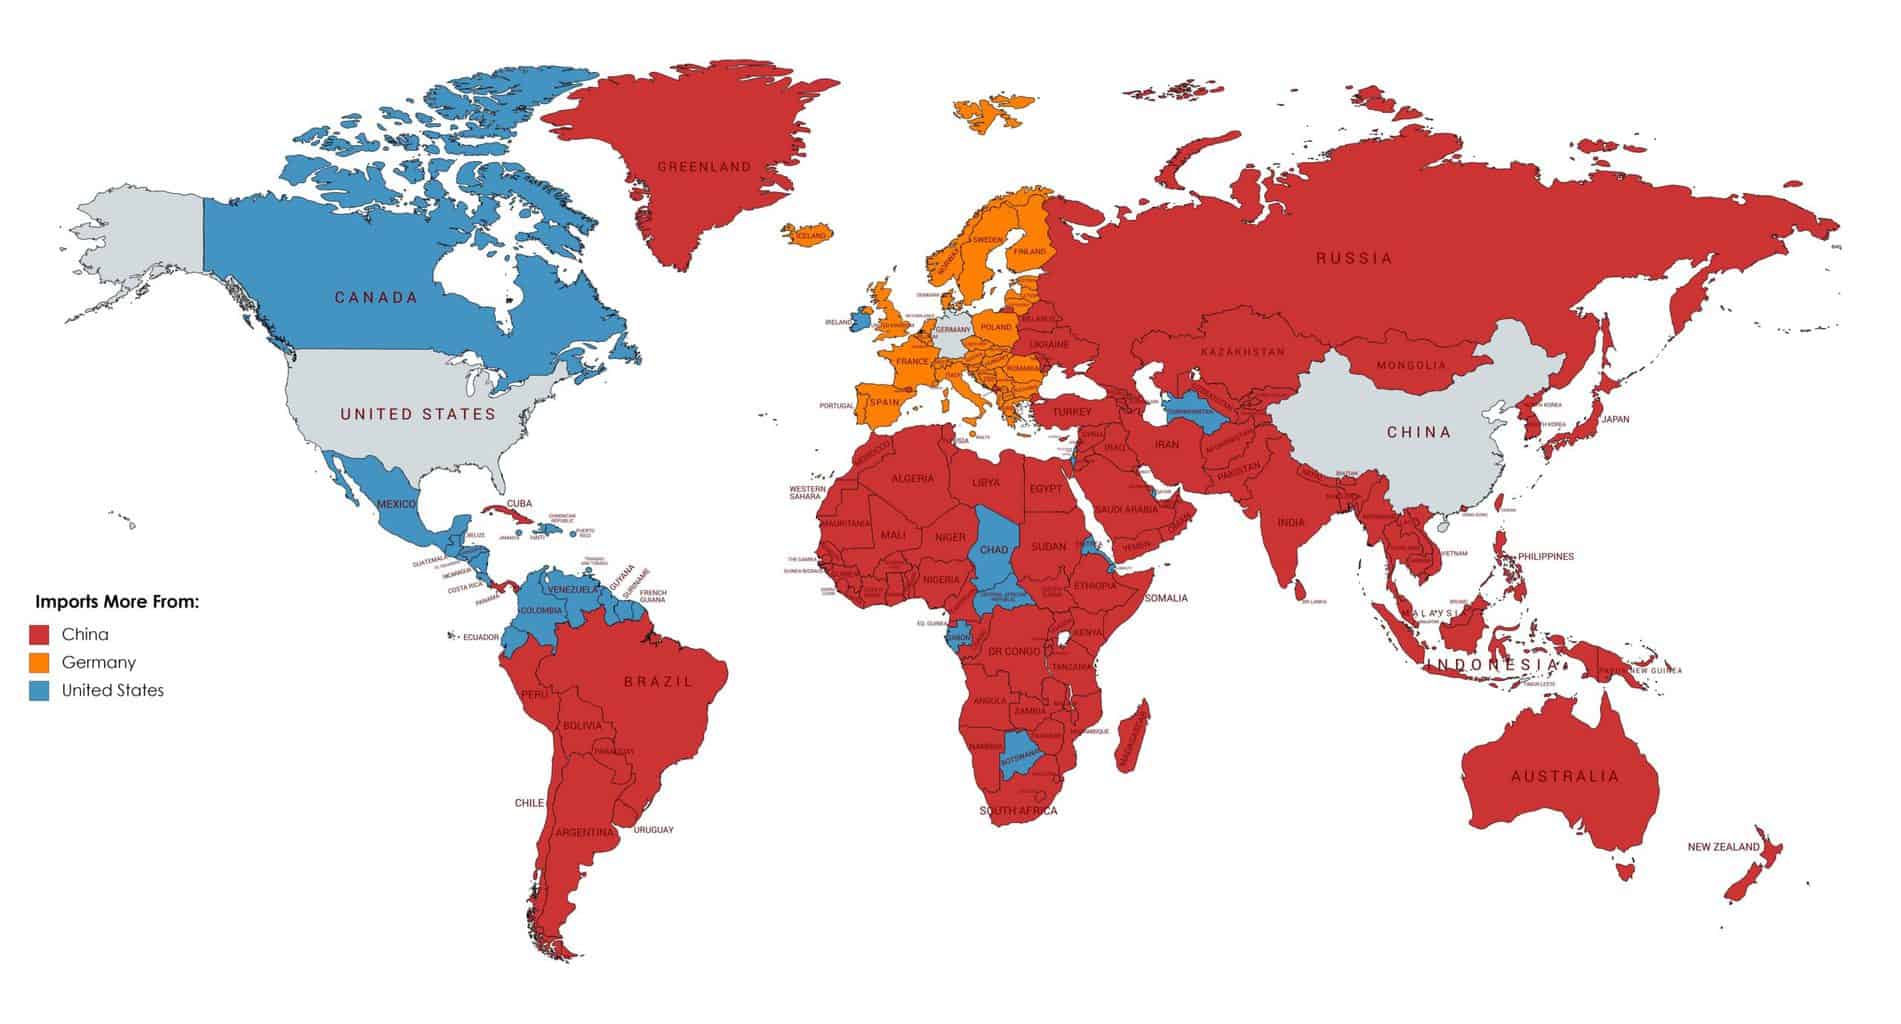
Up until 2001 (the year China joined the WTO) 80% of the world traded more with the US than China. However, today 128 out of 190 countries (2/3rd) trade more with China than the US. With 90 countries trading twice as much with China as the US (dark red).
The map was created by the Lowy Institute using data from the IMF’s Direction of Trade Statistics Database and focuses on bilateral trade flows (both imports and exports).
When looking just at country’s biggest source of imports, the map is even more skewed. Here’s a map of countries that import more from the U.S, Germany or China.
Find these maps interesting? Please help us by sharing them:
Our Top Guides
- 11 Best Card Readers For Small Business
- 11 Best Online Payment Providers
- 21 Best UK Ecommerce Platforms In The UK
- Top 100 UK Card Payment Companies
Other Popular Guides
- UK Merchant Account & Credit Card Processing Fee Comparison
- How to Accept Card Payments Online, In-Store, & By Phone
- Payment Gateways In The UK: What You Need To Know
- Square Card Reader Reviews: UK Payment Fees & Pricing Compared
- SumUp Card Reader Reviews: UK Fees & Pricing
- Dojo Go Card Machine Reviews, Pricing & Fees
- Worldpay Reviews: UK Fees & Pricing
- Top 10 UK Direct Debit Bureau & Recurring Payments Companies
- Contactless Mobile Card Payment Readers: Which Is Cheapest?
- PDQ Machines: Cheap Chip & Pin Card Payment Terminals From £19
- 7 Best Mobile Card Readers With Built-In Receipt Printers
- Credit Card & PDQ Machine Rental Cost: Hire From Just £19
- Square vs Zettle Vs Worldpay & Sumup: Card Reader Comparison
Ted Oberlander says
Great concept. Totally inappropriate map projection – a pity. Greenland and Siberia as huge trading partners. Africa, an area of great interest re subject, is minimized. Should be an equal-area projection, or something close to equal-area, like Robinson.
ElSayed Zayan says
China has succeeded in controlling international trade thanks to successful economic policies, but I believe that American economists will rethink to attract more opportunities to the US economy.
Kurt Harris says
It may be that the u.s. has found ways to acquire resources more effective than by trade.
Luis says
Certainly so far the financing network including the mirage stock exchange market
Bob Dobbbs says
The trade sources from China, but who actually owns the companies conducting the trade? International financiers. That same ones that own US companies. So the country of origin of goods does not tell the whole story.
The other thing to mention is that we notice how China became a dominant global trade partner without much resort to military force as is often concommitant with US trade. So through the mechanism of trade that uses China as an intermediary the reduction in militarization as a component of trade can be considered a positive.
David says
The US is allergic to equality in contracts. A good contract is one where both parties go away having met their goals. The US has a habit of trying to dominate relationships in a very short-sighted way. Maximizing the short term leads to trading partners finding another opportunity. Ever tried winning every argument with your wife? You don’t stay married long.
Daniel H says
How come Greenland’s largest trading partner is China, even though it’s a colony under Denmark? And Denmark’s largest partner is Germany? Kinda doesn’t make sense, but can someone explain?