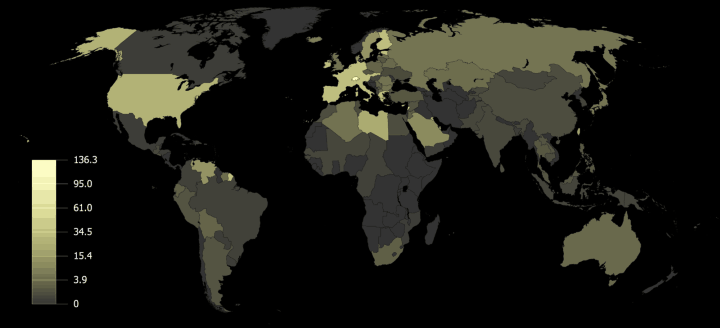
Ever wonder what your share is of your country’s gold reserves? Well wonder no more. The map above shows how much gold you’d get if the reserves were divided evenly.
Swiss citizens lead the world in reserves per person with 136.3 grams. With July 2016 prices of around $42 USD per gram, that means each person in Switzerland’s share is worth over $5,700 USD. Not too bad!
Below you can find figures for most countries around the world based on data from 2011. Please note that the map and table below were created for Wikipedia, based on data from the World Gold Council.
You can find the latest gold price at the bottom of the page, in case you’re wondering what your share’s worth. And if you’d like to buy gold yourself you can find great deals on BullionVault.
| Area | Population | Gold reserves in tonnes | Gram per capita |
| Switzerland | 7,633,271 | 1,040.1 | 136.3 |
| Lebanon | 4,140,243 | 286.8 | 69.3 |
| Netherlands Antilles | 229,645 | 13.1 | 57.0 |
| Eurozone | 322,669,491 | 10,792.5 | 33.4 |
| Aruba | 105,484 | 3.1 | 29.4 |
| Kuwait | 2,846,367 | 79.0 | 27.8 |
| Singapore | 4,724,773 | 127.4 | 27.0 |
| United States of America | 311,997,196 | 8,133.5 | 26.1 |
| Libya | 6,541,767 | 143.8 | 22.0 |
| Taiwan | 23,053,305 | 423.6 | 18.4 |
| Qatar | 845,215 | 12.4 | 14.7 |
| Sweden | 9,082,567 | 125.7 | 13.8 |
| Venezuela | 27,465,835 | 365.8 | 13.3 |
| Denmark | 5,524,306 | 66.5 | 12.0 |
| Saudi Arabia | 29,506,952 | 322.9 | 10.9 |
| Iceland | 310,178 | 2.0 | 6.4 |
| Bahrain | 743,369 | 4.7 | 6.3 |
| Japan | 126,626,004 | 765.2 | 6.0 |
| Russia | 139,006,099 | 784.1 | 5.6 |
| Bulgaria | 7,116,512 | 39.9 | 5.6 |
| United Kingdom | 61,385,414 | 310.3 | 5.1 |
| Algeria | 34,825,464 | 173.6 | 5.0 |
| Romania | 22,160,479 | 103.7 | 4.7 |
| World | 6,875,841,027 | 30,546.1 | 4.4 |
| Kazakhstan | 15,496,742 | 67.3 | 4.3 |
| Suriname | 489,785 | 2.0 | 4.1 |
| Australia | 21,663,346 | 79.9 | 3.7 |
| Belarus | 9,591,779 | 35.3 | 3.7 |
| Latvia | 2,210,167 | 7.7 | 3.5 |
| Macedonia | 2,075,245 | 6.8 | 3.3 |
| Mauritius | 1,299,795 | 3.9 | 3.0 |
| Bolivia | 10,047,732 | 28.3 | 2.8 |
| Poland | 38,452,413 | 102.9 | 2.7 |
| South Africa | 49,094,711 | 124.9 | 2.5 |
| Jordan | 6,488,225 | 12.8 | 2.0 |
| Serbia | 7,324,607 | 13.1 | 1.8 |
| Ecuador | 14,918,083 | 26.3 | 1.8 |
| Lithuania | 3,539,499 | 5.8 | 1.6 |
| Philippines | 101,030,609 | 156.5 | 1.5 |
| Trinidad and Tobago | 1,228,043 | 1.9 | 1.5 |
| Thailand | 66,638,287 | 99.5 | 1.5 |
| Turkey | 78,383,454 | 116.1 | 1.5 |
| Malaysia | 26,420,998 | 36.4 | 1.4 |
| Argentina | 41,595,293 | 54.7 | 1.3 |
| Czech Republic | 10,195,128 | 12.7 | 1.2 |
| Laos | 7,087,667 | 8.8 | 1.2 |
| El Salvador | 6,063,774 | 7.3 | 1.2 |
| Peru | 30,115,664 | 34.7 | 1.2 |
| Syria | 22,451,898 | 25.8 | 1.1 |
| Egypt | 81,415,484 | 75.6 | 0.9 |
| Cambodia | 14,907,288 | 12.4 | 0.8 |
| Sri Lanka | 21,622,468 | 17.5 | 0.8 |
| China | 1,333,962,627 | 1,054.1 | 0.8 |
| Morocco | 31,827,695 | 22.0 | 0.7 |
| Tunisia | 10,649,246 | 6.8 | 0.6 |
| Ukraine | 45,250,507 | 27.5 | 0.6 |
| Guatemala | 13,710,922 | 6.9 | 0.5 |
| India | 1,182,599,587 | 557.7 | 0.5 |
| Kyrgyzstan | 5,554,165 | 2.6 | 0.5 |
| Tajikistan | 7,568,703 | 3.3 | 0.4 |
| Albania | 3,671,632 | 1.6 | 0.4 |
| WAEMU | 99485261 | 36.5 | 0.4 |
| Pakistan | 178,846,050 | 64.4 | 0.4 |
| Papua New Guinea | 6,136,694 | 2.0 | 0.3 |
| Hungary | 9,864,998 | 3.1 | 0.3 |
| Indonesia | 244,535,321 | 73.1 | 0.3 |
| Korea, South | 48,710,208 | 14.4 | 0.3 |
| China, Hong Kong SAR | 7,109,657 | 2.1 | 0.3 |
| Mongolia | 3,114,066 | 0.9 | 0.3 |
| CEMAC | 319,470,944 | 102.7 | 0.3 |
| Fiji | 965,473 | 0.2 | 0.2 |
| Brazil | 202,482,844 | 33.6 | 0.2 |
| Colombia | 44,511,121 | 6.9 | 0.2 |
| Paraguay | 6,424,800 | 0.7 | 0.1 |
| Mozambique | 22,294,275 | 2.3 | 0.1 |
| Canada | 33,918,089 | 3.4 | 0.1 |
| Honduras | 8,080,289 | 0.7 | 0.1 |
| Uruguay | 3,519,648 | 0.3 | 0.1 |
| Bangladesh | 159,242,804 | 13.5 | 0.1 |
| Yemen | 23,868,673 | 1.6 | 0.1 |
| Mexico | 113,207,390 | 7.3 | 0.1 |
| Dominican Republic | 9,879,476 | 0.6 | 0.1 |
| Malawi | 15,697,470 | 0.4 | 0.0 |
| Costa Rica | 4,551,966 | 0.1 | 0.0 |
| Chile | 16,830,930 | 0.2 | 0.0 |
| Burundi | 10,068,983 | 0.0 | 0.0 |
| Comoros | 785,786 | 0.0 | 0.0 |
| Haiti | 9,302,365 | 0.0 | 0.0 |
| Kenya | 40,654,681 | 0.0 | 0.0 |
| Oman | 3,002,517 | 0.0 | 0.0 |
David Finnegan says
I note that your graph shows Ireland as having significant gold reserves but it didn’t appear on the per capita table. Can you up date?
John Coles says
Part of the Eurozone which has >30g per person
Paulo Ferreira says
Portugal is missing in top 10
anobudelip says
Bingo!
Greg Norris says
I am looking for a chart that would show a history of these numbers not only per country but for the world population. I want to see how much the ounces per population of the world has changed over time. I am beginning to think that Gold is actually quite high based upon silver to gold ratios, which historically was around 20 to 1, until late 1800’s when suddenly that ratio jumped to 35 to 1. Now it is at nose bleed levels of over 100 to 1, although it has settled down quite a bit lately down to the more normal peak of 80 to 1. I also noticed when I looked up historically what an ounce of silver could buy you around 1920 and it was about four gallons of gasoline. A gold coin would buy you a nice suit and a dinner out for two. Based upon those data points, silver should only be worth around 12 dollars an ounce (assuming price of gas is unusually low due to the pandemic) and an ounce of gold would only be worth around 500 dollars an ounce tops at the more normal ration of 40:1. I am trying to wrap my brain around why lately the ratio of silver to gold is ranging from 40:1 to 80:1 typically yet especially when the claim is that silver is being used up at an alarming rate due to its use in electronics. Silver to gold ratios should be dropping, but it is not. Someone is lying their ass off!!!!
Mahendrasinh Jhala says
Thanks for the information, This information seems limited to official figures of gold reserves with the central banks of countries, India has a tradition of keeping gold ornaments by each household, marriage ceremonies gifts dowry etc are dealt with gold ornaments compulsorily as it is customary in India , each and every women in India owns at least minimum of 10 grams of gold and excluding the 50% or 60% of lower income population rest of 40% to 50% middle and upper income population owns more than 100 grams or so per households