The pandemic has accelerated our journey to a cashless society. But it seems not everyone is ready to completely let go of cash transactions.
We have taken an in-depth look at payment methods including by card reader of different countries around the world to find the nations where physical cash still takes precedence, despite the increasing popularity of digital payment wallets such as Apple Pay and Paypal. The study also looks into the UK’s changing habits with cash and predicts when they can expect to be a completely cashless society.
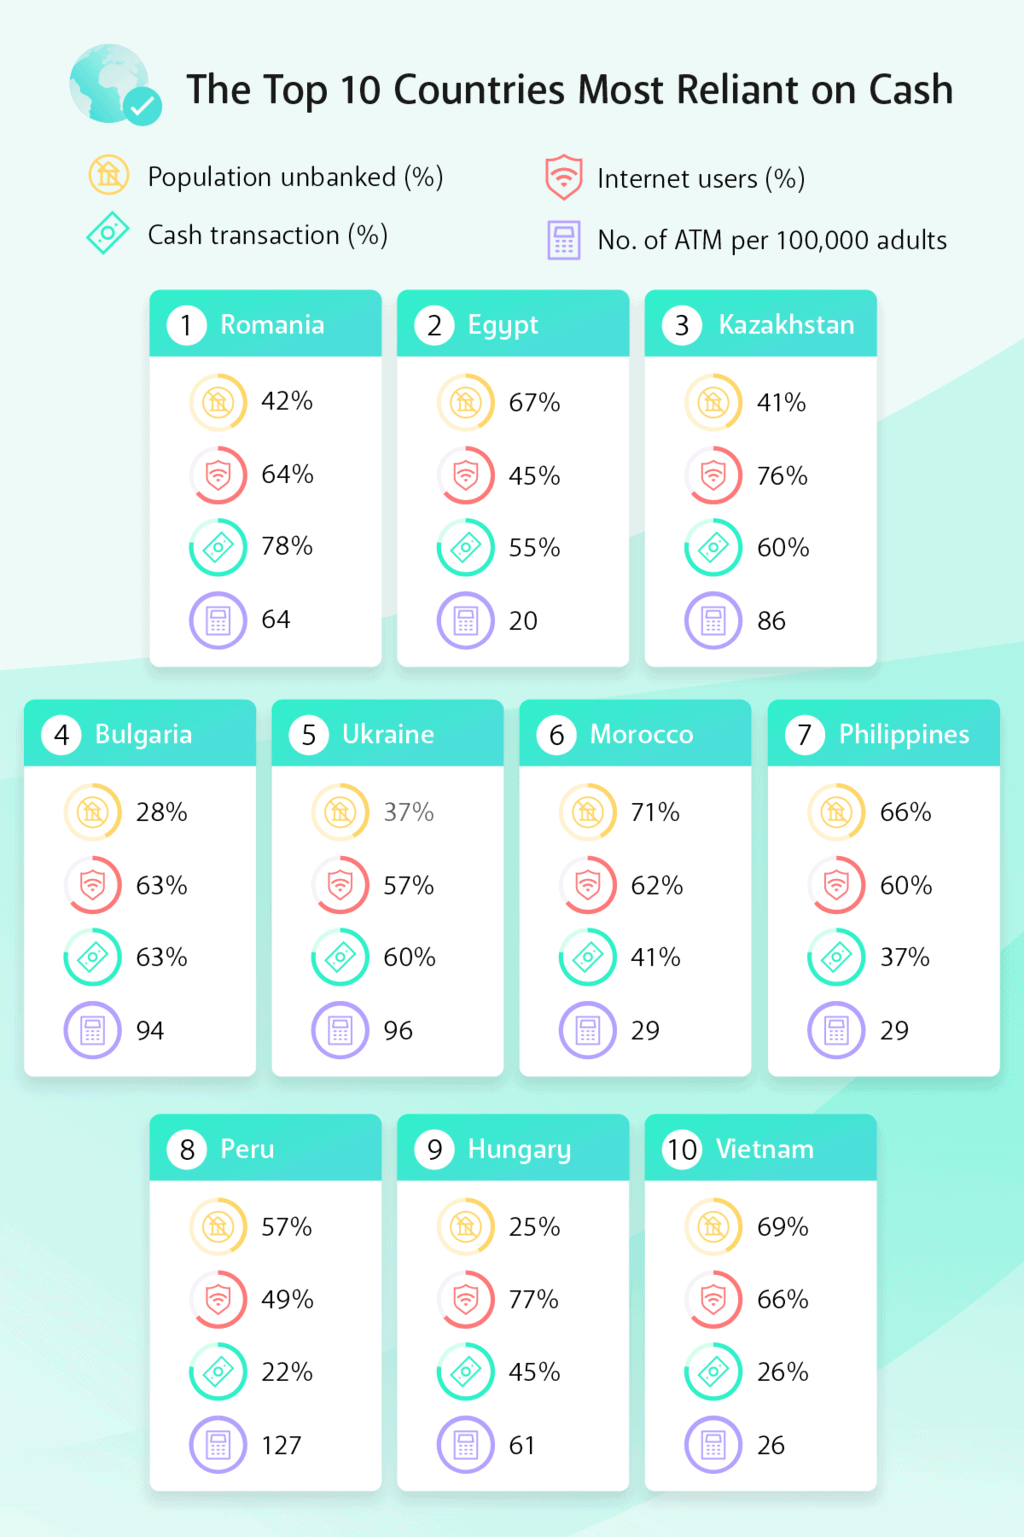
The Top 10 Countries Most Reliant on Cash
With over 70% of payments made in cash, Romania has been revealed as the country most reliant on physical cash. Nearly half (42%) of the Eastern European country population is unbanked showing that many of the citizens still cling to notes and coins.
In Norway, on the other hand, only 3% of transactions are made in cash. Whilst there are only 31.6 ATMs per 1000 adults, the research found that 100% of the population own a bank account.
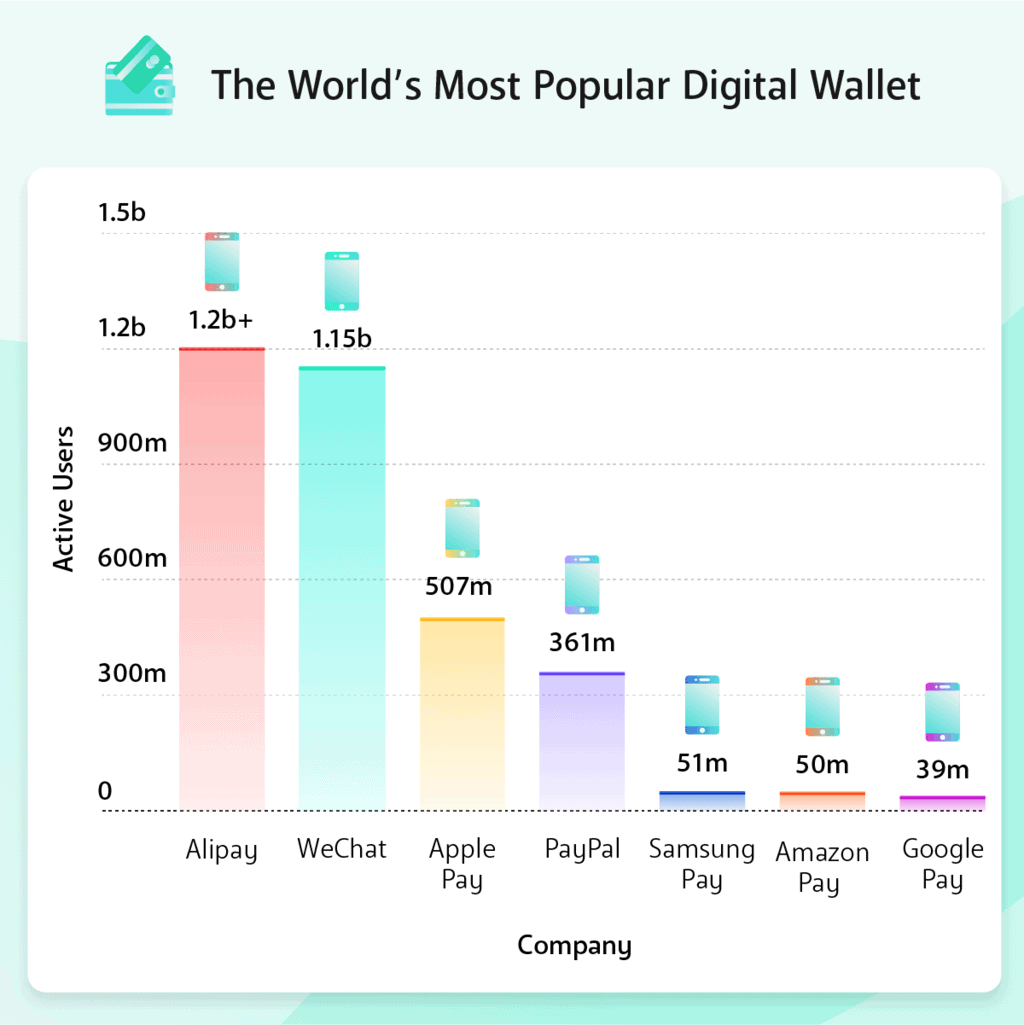
The World’s Most Popular Digital Wallets
Digital Wallets, also referred to as e-wallets, allow users to make cashless payments via a wearable device such as a smartwatch or their mobile phone.
Over the years digital wallets have increasingly seen a rise in popularity and the Covid-19 pandemic has only helped accelerate this. In 2013, Alipay overtook Paypal as the world’s largest mobile payment platform and they have not slowed down since as the digital wallet now has over 1 billion active users.
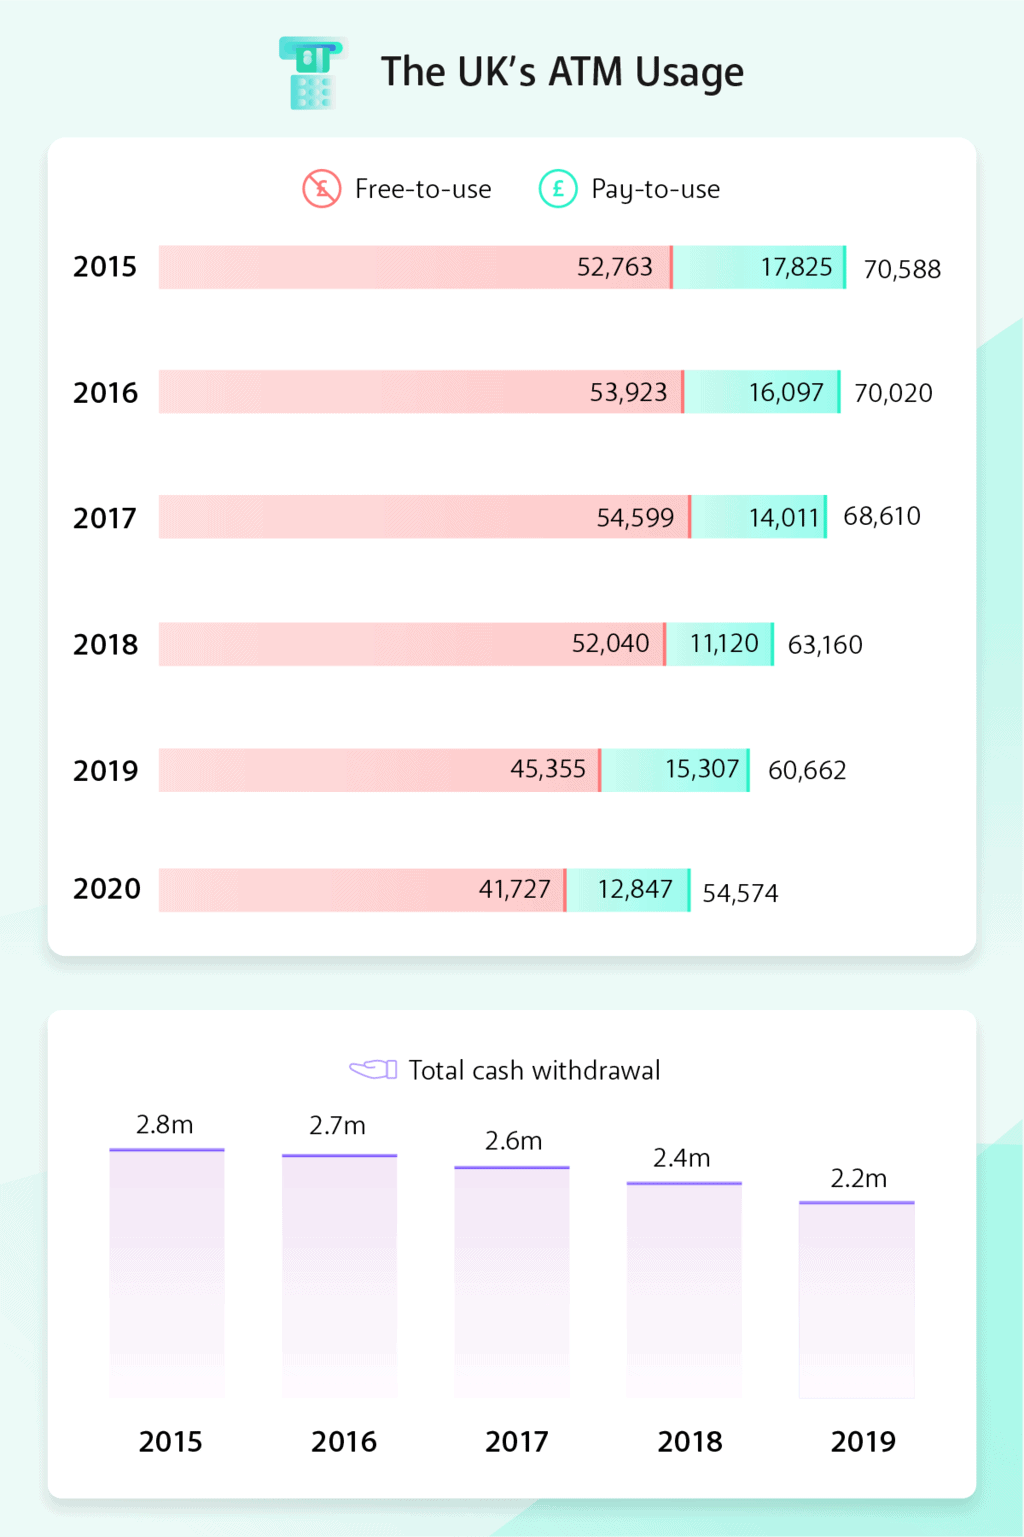
The UK’s ATM Usage
The past 10 years has seen the number of cash withdrawals in the UK drop by 22%. In fact, with only two million cash withdrawals, 2019 saw a 9% decrease in the volume of ATM usage made by UK cardholders from the previous year.
Between 2019 and 2020 the country saw an 8% closure of free-to-use cashpoints leaving approximately 24% of bank machines charging Brits to withdraw their own money.
Despite this, 96% of cash withdrawals at UK ATMs made by UK cardholders still remain free of charge.
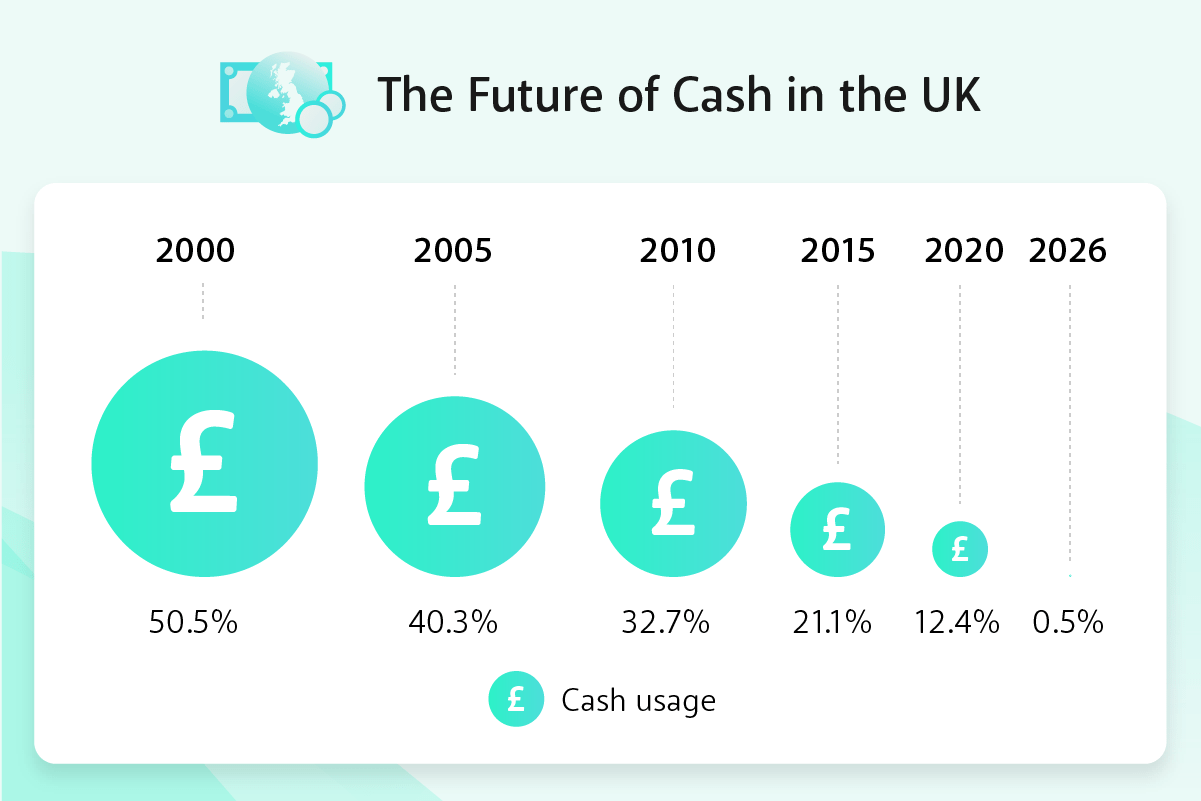
The Future of Cash in the UK
Cash usage in the UK has seen a sharp decline over the last few years. This alongside the current coronavirus pandemic has meant that many businesses have asked customers to pay by alternative means such as bank cards and e-wallets.
If we continue on the current downhill slope, we can predict that cash usage in the UK will reach 0% by as soon as 2026.
| Region | Online Population | Internet Peneration (%) | Banked Population (%) | Unbanked Population (%) | Credit Card Penetration (%) | Card Transcation (%) | Cash Transcation (%) | E-Wallet (%) | Bank Transfer | Other |
|---|---|---|---|---|---|---|---|---|---|---|
| Asia Pacific | 1800000000 | 50% | 76% | 24% | 14% | 30% | 7% | 46% | 13% | 4% |
| Eastern Europe and the CIS | 188300000 | 69% | 67% | 33% | 18% | 34% | 24% | 23% | 16% | 3% |
| North America | 408800000 | 83% | 79% | 21% | 52% | 59% | 4% | 22% | 8% | 6% |
| South and Central America | 239300000 | 67% | 62% | 38% | 24% | 58% | 17% | 10% | 13% | 2% |
| The Middle East and Africa | 375800000 | 65% | 50% | 50% | 12% | 44% | 23% | 11% | 14% | 8% |
| Western and Central Europe | 420500000 | 87% | 94% | 6% | 45% | 43% | 6% | 21% | 24% | 7% |
| Region | Country | Online Population | Internet Peneration (%) | Banked Population (%) | Unbanked Population (%) | Number of ATM per 100,000 Adults | Credit Card Penetration (%) | Card Transcation (%) | Cash Transcation (%) | E-Wallet (%) | Bank Transfer (%) | Other (%) | Total Index |
|---|---|---|---|---|---|---|---|---|---|---|---|---|---|
| Eastern Europe and the CIS | Romania | 12,400,000.00 | 64% | 58% | 42% | 64.44 | 12% | 19% | 78% | 0% | 2% | 1% | 7.88 |
| The Middle East and Africa | Egypt | 44,200,000.00 | 45% | 33% | 67% | 20.07 | 3% | 27% | 55% | 8% | 9% | 1% | 7.45 |
| Eastern Europe and the CIS | Kazakhstan | 14,000,000.00 | 76% | 59% | 41% | 85.94 | 20% | 20% | 60% | 0% | 20% | 0% | 7.29 |
| Eastern Europe and the CIS | Bulgaria | 4,500,000.00 | 63% | 72% | 28% | 94.33 | 14% | 26% | 63% | 5% | 7% | 0% | 7.26 |
| Eastern Europe and the CIS | Ukraine | 25,500,000.00 | 57% | 63% | 37% | 96.3 | 27% | 28% | 60% | 5% | 5% | 2% | 7.13 |
| The Middle East and Africa | Morocco | 22,300,000.00 | 62% | 29% | 71% | 28.58 | 0% | 27% | 41% | 15% | 10% | 7% | 7.04 |
| Asia Pacific | Philippines | 64,000,000.00 | 60% | 34% | 66% | 28.98 | 2% | 22% | 37% | 8% | 29% | 5% | 6.84 |
| South and Central America | Peru | 15,600,000.00 | 49% | 43% | 57% | 126.71 | 12% | 62% | 22% | 3% | 11% | 2% | 6.58 |
| Western and Central Europe | Hungary | 7,500,000.00 | 77% | 75% | 25% | 60.95 | 13% | 44% | 45% | 5% | 5% | 1% | 6.52 |
| Asia Pacific | Vietnam | 63,300,000.00 | 66% | 31% | 69% | 25.9 | 4% | 35% | 26% | 14% | 26% | 5% | 6.39 |
| North America | Mexico | 83,300,000.00 | 66% | 37% | 63% | 61.54 | 10% | 44% | 21% | 16% | 16% | 3% | 6.34 |
| Western and Central Europe | Czech Republic | 9,400,000.00 | 88% | 81% | 19% | 58 | 25% | 22% | 44% | 3% | 27% | 4% | 6.18 |
| The Middle East and Africa | Nigeria | 137,100,000.00 | 70% | 40% | 60% | 16.93 | 3% | 27% | 24% | 10% | 24% | 16% | 6.10 |
| The Middle East and Africa | Saudi Arabia | 27,700,000.00 | 82% | 72% | 28% | 73.34 | 16% | 35% | 34% | 8% | 10% | 12% | 6.07 |
| The Middle East and Africa | Kenya | 42,500,000.00 | 83% | 56% | 44% | 7.69 | 6% | 25% | 40% | 0% | 0% | 35% | 6.03 |
| Western and Central Europe | Slovakia | 4,400,000.00 | 82% | 84% | 16% | 61.84 | 22% | 17% | 41% | 8% | 25% | 9% | 6.00 |
| South and Central America | Uruguay | 2,400,000.00 | 68% | 64% | 36% | 120.07 | 41% | 53% | 26% | 8% | 12% | 1% | 5.96 |
| Asia Pacific | Indonesia | 146,400,000.00 | 55% | 49% | 51% | 53.41 | 2% | 34% | 13% | 17% | 29% | 7% | 5.91 |
| South and Central America | Colombia | 30,900,000.00 | 62% | 46% | 54% | 41.28 | 14% | 55% | 15% | 9% | 21% | 1% | 5.90 |
| Western and Central Europe | Greece | 7,500,000.00 | 70% | 85% | 15% | 63.4 | 12% | 54% | 29% | 6% | 10% | 1% | 5.87 |
| South and Central America | Argentina | 33,700,000.00 | 76% | 49% | 51% | 60.89 | 24% | 45% | 18% | 18% | 17% | 2% | 5.87 |
| Eastern Europe and the CIS | Russia | 109,800,000.00 | 76% | 76% | 24% | 165.5 | 20% | 37% | 17% | 28% | 17% | 3% | 5.84 |
| Eastern Europe and the CIS | Estonia | 1,200,000.00 | 88% | 98% | 2% | 66.87 | 29% | 21% | 12% | 9% | 9% | 1% | 5.73 |
| South and Central America | Brazil | 141,300,000.00 | 67% | 70% | 30% | 101.67 | 27% | 62% | 18% | 10% | 9% | 1% | 5.71 |
| Asia Pacific | Thailand | 36,700,000.00 | 53% | 82% | 18% | 115.09 | 10% | 26% | 16% | 23% | 24% | 12% | 5.53 |
| The Middle East and Africa | South Africa | 32,500,000.00 | 56% | 69% | 31% | 65.31 | 9% | 43% | 11% | 17% | 21% | 8% | 5.47 |
| Asia Pacific | India | 466,000,000.00 | 34% | 80% | 20% | 20.95 | 3% | 32% | 17% | 26% | 18% | 7% | 5.36 |
| Western and Central Europe | Poland | 28,900,000.00 | 76% | 87% | 13% | 70.55 | 17% | 25% | 12% | 13% | 47% | 2% | 5.25 |
| Eastern Europe and the CIS | Lithuania | 2,200,000.00 | 78% | 83% | 17% | 38.6 | 16% | 24% | 12% | 9% | 49% | 5% | 5.15 |
| South and Central America | Chile | 15,400,000.00 | 82% | 74% | 26% | 49.62 | 30% | 70% | 11% | 3% | 12% | 4% | 5.14 |
| The Middle East and Africa | Turkey | 53,200,000.00 | 65% | 69% | 31% | 83.95 | 42% | 71% | 8% | 5% | 13% | 3% | 5.11 |
| Asia Pacific | China | 756,300,000.00 | 54% | 80% | 20% | 95.55 | 21% | 22% | 6% | 56% | 13% | 3% | 5.07 |
| Asia Pacific | Malaysia | 25,300,000.00 | 80% | 85% | 15% | 44.71 | 21% | 32% | 11% | 6% | 46% | 5% | 5.04 |
| Eastern Europe and the CIS | Latvia | 1,600,000.00 | 81% | 93% | 7% | 58.28 | 17% | 49% | 12% | 14% | 20% | 5% | 5.03 |
| Western and Central Europe | Portugal | 7,600,000.00 | 74% | 92% | 8% | 169.91 | 34% | 38% | 11% | 17% | 13% | 21% | 5.03 |
| Asia Pacific | South Korea | 49,100,000.00 | 95% | 95% | 5% | 266.97 | 64% | 73% | 2% | 12% | 11% | 2% | 5.00 |
| The Middle East and Africa | United Arab Emirates | 9,100,000.00 | 95% | 88% | 12% | 60.91 | 45% | 39% | 20% | 18% | 16% | 7% | 4.96 |
| Western and Central Europe | Austria | 455,700,000.00 | 88% | 98% | 2% | 171.96 | 47% | 28% | 4% | 20% | 46% | 2% | 4.82 |
| Western and Central Europe | Spain | 39,500,000.00 | 85% | 94% | 6% | 106.31 | 54% | 49% | 11% | 22% | 13% | 5% | 4.67 |
| Western and Central Europe | France | 60,300,000.00 | 90% | 94% | 6% | 98.29 | 41% | 55% | 5% | 19% | 16% | 6% | 4.60 |
| Western and Central Europe | Italy | 47,700,000.00 | 79% | 94% | 6% | 90.17 | 42% | 41% | 8% | 29% | 10% | 12% | 4.55 |
| Asia Pacific | Australia | 22,000,000.00 | 88% | 100% | 0% | 146.12 | 60% | 53% | 5% | 22% | 16% | 5% | 4.46 |
| North America | Canada | 34,400,000.00 | 93% | 100% | 0% | 214.14 | 83% | 73% | 3% | 14% | 9% | 2% | 4.45 |
| Western and Central Europe | Germany | 77,100,000.00 | 93% | 99% | 1% | 119.93 | 53% | 11% | 4% | 25% | 52% | 8% | 4.39 |
| Western and Central Europe | Belgium | 10,000,000.00 | 88% | 99% | 1% | 80.97 | 48% | 51% | 6% | 14% | 23% | 7% | 4.38 |
| Western and Central Europe | UK | 62,900,000.00 | 95% | 96% | 4% | 110.28 | 65% | 56% | 7% | 25% | 8% | 5% | 4.36 |
| Asia Pacific | Singapore | 4,800,000.00 | 84% | 98% | 2% | 58.78 | 49% | 75% | 4% | 10% | 10% | 1% | 4.34 |
| Asia Pacific | Japan | 118,100,000.00 | 93% | 98% | 2% | 124.12 | 68% | 68% | 6% | 3% | 13% | 11% | 4.28 |
| The Middle East and Africa | Israel | 7,200,000.00 | 82% | 93% | 7% | 133.17 | 75% | 76% | 1% | 21% | 0% | 2% | 4.25 |
| Western and Central Europe | Switzerland | 8,000,000.00 | 94% | 98% | 2% | 97.15 | 65% | 25% | 2% | 16% | 56% | 1% | 4.21 |
| Western and Central Europe | Denmark | 5,600,000.00 | 97% | 100% | 0% | 44.78 | 45% | 54% | 3% | 22% | 14% | 6% | 4.18 |
| Asia Pacific | Hong Kong | 6,700,000.00 | 89% | 95% | 5% | 53.18 | 65% | 43% | 8% | 30% | 13% | 5% | 4.18 |
| Western and Central Europe | Netherlands | 16,100,000.00 | 93% | 100% | 0% | 41.08 | 39% | 19% | 0% | 8% | 65% | 8% | 4.14 |
| Asia Pacific | Taiwan | 20,700,000.00 | 88% | 94% | 6% | 53% | 42% | 12% | 14% | 19% | 14% | 4.13 | |
| Asia Pacific | New Zealand | 4,400,000.00 | 91% | 99% | 1% | 63.54 | 61% | 55% | 3% | 17% | 22% | 3% | 4.10 |
| Western and Central Europe | Finland | 5,300,000.00 | 96% | 100% | 0% | 34.71 | 63% | 23% | 2% | 14% | 57% | 4% | 3.90 |
| Western and Central Europe | Sweden | 9,800,000.00 | 96% | 100% | 0% | 31.86 | 45% | 46% | 2% | 6% | 24% | 22% | 3.88 |
| North America | USA | 291,200,000.00 | 89% | 93% | 7% | 66% | 59% | 4% | 23% | 8% | 6% | 3.82 | |
| Western and Central Europe | Norway | 5,100,000.00 | 97% | 100% | 0% | 31.58 | 71% | 50% | 3% | 14% | 18% | 14% | 3.67 |
Inés says
Hi!
I would like to know what is the source of the last chart and from what date?
Particularly, need to know the African market information where is it from and the year of this information.
Kind regards!
Anh Bui says
Could you share the information about the source of payment information of the last chart, particularly Asia region. Thank you very muchh for your kindness!. Regards
Erick Mares says
Hi, is this report going to be updated periodically?
CAMILLO TEIXEIRA TESTA says
Hey, could you guys share the precise source of the dataset above providing information on internet penetration, both banked and unbanked population, ATM, credit card penetration, and credit transactions per country, for correct citation on an academic paper?
Ahmet says
Hello, could you please share source of the report?
Sara says
Hi, Can you share the methodology and references used behind these numbers?
Ouissal says
Can you please share the methodology of the study?
Lee Jones says
Where is the data from? Could you let me know please.
Gareth Jones says
Was the source of the data question answered? Keen to know where the data is from.
Mauricio Bomfim says
I was also looking for the source. After some research, it seems to come from The World Bank – The Global Findex Database (https://www.worldbank.org/en/publication/globalfindex/Data), complement of “Account (% age 15+)”, data from 2017. The 2021 data are quite different.