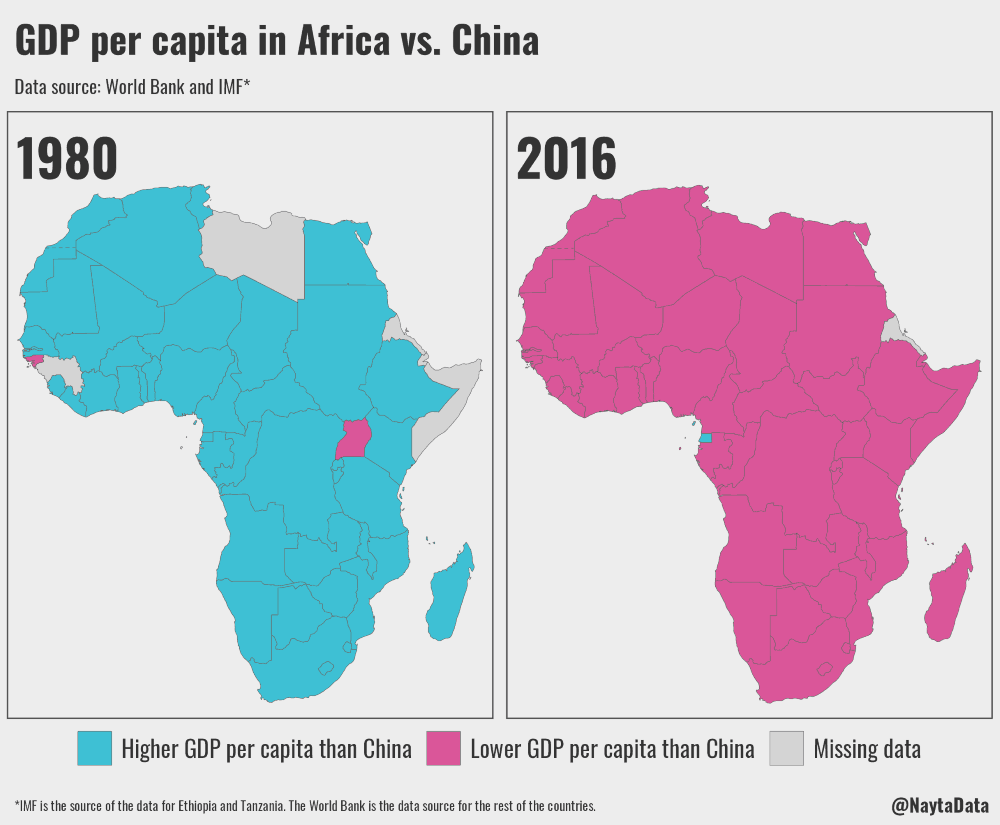
The map above shows relative GDP per capita of African countries compared to China in 1980 and again in 2016. In 1980 China’s GDP per capita was only $194.80 per person. This was lower than all African countries except Guinea-Bissau ($138.17) and Uganda ($99.18).
However, by 2016 China’s GDP per capita has increased to $8,117.27 per person, a staggering 41X increase. This made it richer per person than almost all African countries expect Equatorial Guinea ($9,217.89 per person; although this is distributed extremely unevenly) and the Seychelles ($15,060.99 per person; not shown).
Interestingly, by 2016 Uganda and Guinea-Bissau were no longer the poorest countries per capita in Africa with Uganda increasing it’s GDP per capita to $580.38 (nearly a 6X improvement) and Guinea-Bissau increasing it to $648.90 (nearly a 5X improvement).
However, China is not exactly rich on a per capita basis, and was still slightly poorer per person than Mexico or Russia ($8,443.69 and $8,748.37 respectively) in 2016. In comparison US GDP per capita is $57,588.54, Australia’s is $49,896.68, Canada’s is $42,348.95, and the UK’s is $40,412.03.
The data comes from the World Bank and IMF and is shown in current US dollars.
Find this post interesting? Please help by sharing it:

Leave a Reply